My Session From CollabSphere 2022 | DEV107 | Building Emotionally Available XPages Applications
Posted: November 7, 2022 Filed under: Collabsphere, Domino, HCL, XPages | Tags: Collabsphere, Domino, HCL, High Availability, XPages Leave a commentSession abstract:
Over the past few years, High Availability (HA) has become more and more a requirement for Web applications. Even though classic XPage development does not lend itself well to High Availability/Reverse Proxy environments, Domino XPages has plenty of tools to build modern web applications based on micro-services and APIs that DO work well in HA environments and allow developers to tap into existing back-end code and leverage data stored in Domino databases. What if your user was editing an XPage and your server goes down? Clustering alone does not solve the problem. This session will demonstrate an approach we use to add HA functionality to our clustered enterprise XPage applications to minimize user disruptions and lost work. Note: this session will NOT demonstrate how to set up HA reverse proxy servers and will focus on what happens in the front-end in the browser and the back-end in Domino.
My CollabSphere session | DEV115 | Using XPages and Bootstrap tabs to build a (Monolithic) Single-Page Application (of Micro Front-Ends)
Posted: November 2, 2021 Filed under: Bootstrap, Collabsphere, Domino, XPages | Tags: Bootstrap, Collabsphere, Domino, HCL, XPages 5 CommentsIt’s been two weeks since CollabSphere but better late than never in releasing my session, right?
Once again, Richard and his team have pulled off a phenomenal event. Whether joining as an attendee or a speaker, the mechanism by which one could participate in sessions really could not be any smoother. Having presented at Collabsphere previously in person, I was thrown off initially by not being able to feel the “energy” in the room so to speak, but I quickly settled in and felt quite comfortable.
flexTabs
The session starts out focusing on solutions I’ve built within my organization but ends with “flexTabs” demos – a soon-to-be-released project that can make creating dynamic XPage applications easier and faster. Enjoy!
HCL Notes 12 / Windows 11 Preview ARM64 / Parallels on M1 Macbook Pro 16″
Posted: October 27, 2021 Filed under: Domino, HCL | Tags: HCL, Notes12, Parallels Leave a commentWith the recent arrival of the powerful new Macbook Pros armed with the Apple M1 chip, the elephant in the room for many Domino developers was how will the ability to virtualize Windows in order to run Notes and Designer be affected. Like many others, I have run Parallels since its release in 2005 to support the virtualization abilities of the Intel Macbook Pros released at that time.
The initial virtualization prospects on the M1 machines looked daunting .. you need an ARM64 version of Windows and links to official Microsoft downloads that were being linked to by Parallels were not working. Uh oh. Maybe not the best road to go down if you rely on virtualization as a production setup.
However, with my 2017 Macbook Air starting to show its age, I decided to take a hard look at the new Macbook Pros. Since it is not my primary work machine and I use the Mac side of things to do a bunch of personal stuff, rolling the dice seemed like a worthwhile thing to do, so I waltzed into my local Apple store and ended up walking out with a 16″ Macbook Pro with an M1 Pro processor. With a little trial and error, it ended up being pretty easy to get the ARM64 version of Windows 11 Preview installed.
DO THIS
- If you haven’t already, register for the Windows Insider program.
- Download the Windows 11 Preview ARM64 .vhdx file. The screenshots below show how to find it on the Windows Insider site.
- In Parallels create a new VM and point it to the downloaded file.
- Sit back and relax!


Installing Notes/Designer/Admin 12
Once the Windows installation was completed the next step was to install Notes. After downloading the .exe from Flexnet the installation went as smooth as expected. I copied stuff from my data dir on my Notes 11VM – working sets, dbs, etc. with no problem.
DO NOT DO THIS
Before taking the official route outlined above, I tried some of the other methods (for example UUP Dump) where you download a package with shell scripts that go out and download all of the necessary installation files and packages them up into an ISO image. Despite successfully downloading and building the ISO images, the installations crapped out almost immediately.
NEXT STEPS
There is a lot of blogging and building of demos I want to get to so I plan on putting this configuration through its paces. in the near future. Having used the 13″ MacBook Air for the past 4.5 years or so, my first impression of the 16″ screen was that it’s waaay too big. But it is growing on me and feels long overdue. I’m looking forward to having some fun with this machine.
Join me at CollabSphere 2021!
Posted: October 15, 2021 Filed under: Bootstrap, Domino, HCL, jQuery, XPages | Tags: Bootstrap, Collabsphere, Domino, HCL, jQuery, XPages Leave a commentCollabSphere, perennially a great conference, will be held virtually for the 2nd year in a row from Oct. 19th – Oct. 21st and I am fortunate to be presenting a session this year.
DEV115: Using XPages and Bootstrap tabs to build a (Monolithic) Single-Page Application (of Micro Front-ends)
Time: Tuesday 10/19 @ 2PM EST
While the title is a bit wordy, it is meant to be a little cheeky … This session will demonstrate how at Mutual Boiler Re we use Bootstrap tabs and jQuery to provide our XPages applications with a structure that allows multiple pages, views, and documents to be opened within one browser tab, essentially creating a Single Page Application that mimics the Notes Client in a browser.
Thank you to Richard and the Collabsphere team for this opportunity. I look forward to seeing you there!
Kudos to HCL
Posted: July 22, 2021 Filed under: Domino, HCL, XPages | Tags: Domino, HCL, XPages 1 CommentLast week I received a nice little gift in my inbox … an email from HCL with an update to an SPR I submitted late last year indicating the defect identified in that SPR was RESOLVED.

This bug was incredibly annoying for me and the workaround initially suggested didn’t make sense… and even though I was able to reproduce the issue in each version and had to push a bit to get this issue upgraded to an SPR, ultimately HCL listened to the customer and resolved the issue.
While not listed above, according to the release notes for Domino 10.0.1 FP7, this defect has also been resolved in that fix pack.
Reader question – How does the Flexible View Control handle response documents?
Posted: January 11, 2021 Filed under: DataTables, Domino, HCL, JavaScript, jQuery, low-code, XPages | Tags: DataTables, Domino, HCL, jQuery, low-code, XPages 2 CommentsRecently, I received a comment on a blog post asking how the FVC handles response documents:
One question I have is how best to deal with response documents in views, I am not sure if I have missed something in the tutorials but I am unsure how to render responses or if the control handles views with responses?
In building the control, response documents were never even a consideration for me since we don’t use them in our environment so the Flexible View Control does not contain specific functionality for handling response documents. However, because the framework was built to be as flexible and configurable as possible, the tools provided make creating that functionality incredibly easy. Based on the comment above I created a demo to prove that:
http://demos.xpage.me/demos/datatables-xpages-bootstrap.nsf/viewGeneral.xsp?viewdef=response-docs
Building the Demo
For this demo I created a new used car database and added some records from the original used car database. In addition to the listing form that already existed for the main docs, I added a response form and response to response form so I could add comments to listings and comments to comments:

On both the response and response to response forms the ID field from the original document is being inherited to have a common value to link all of the documents besides docids, but it’s not really necessary to make the demo function properly.

Notes View Configuration
To get the View set up I need to make sure that Show response documents in a hierarchy is turned on and add the comments and parent_docid columns.
Note: No column is set to “show responses only”.

After adding a couple of responses in the Notes Client the back-end view looks like this:

The View Definition
In the View Definition I’m setting the columns for the responses to hidden because I don’t need that data to display. We *do* need the comments column to display but you will see momentarily how that will be done.

The REST Service
Another important step is making sure the REST service being utilized to serve the data contains the appropriate document hierarchy information. Since we are using the standard <xe:viewJsonService>, the system columns can be configured to include the position data in addition to the unid. By default, all of the columns are enabled but I prefer to remove the ones I don’t need to cut down on payload size.

Now we have the data we need:

Configuring the Flexible View Control
So after all this setup we still haven’t actually displayed anything with the control yet. How do we go about doing that? Before adding functionality to create the response hierarchy in the control the response docs look like standard docs, but with little information:

The Callbacks
The first step I take to build the response hierarchy is adding a createdRow callback function to the control. Normally, I would probably use a rowCallback out of habit but in the process of tinkering around, I moved my rowCallback code into the createdRow callback. Here is what the DataTables documentation says about each:
rowCallback
This callback allows you to ‘post process’ each row after it have been generated for each table draw, but before it is rendered into the document. This means that the contents of the row might not have dimensions ($().width()for example) if it is not already in the document.
This function might be used for setting the row class name or otherwise manipulating the row’strelement (although note thatcreatedRowcan often be more efficient).
createdRow
This callback is executed when aTRelement is created (and allTDchild elements have been inserted), or registered if using a DOM source, allowing manipulation of theTRelement.
This is particularly useful when using deferred rendering (deferRender) or server-side processing (serverSide) so you can add events, class name information or otherwise format the row when it is created.
There are a few things that need to be accomplished in the createdRow:
- For responses, reconstruct the response row to be more like the “classic” Notes response document and add classes and attributes that connect it to its parent row.
- For non-responses, add that document’s docid as a row class and add a click event that will expand and collapse any responses.
- For responses with responses, add a click event to expand/collapse its child documents.
- Use the position data to provide classes and attributes to the response rows to make it easier to build our hierarchy.
rowCallbackResponse : function(row,data,index,params,o) {

	var attr = $(row).attr("data-docid");

	// For some browsers, `attr` is undefined; for others, `attr` is false. Check for both.
	if (typeof attr !== typeof undefined && attr !== false) {
	  // Element has this attribute
		return;
	}

	// action item view on pcspDocument
	$(row).attr("data-docid",data['@unid']);

	// get the colspan
	var colspan = $('td',row).length;

	// if this is a response then add some info to this row
	var position = data['@position'];

	if (position.split('.').length > 1) {
		// remove cells and replace with 1
		$(row).html('<td colspan="' + colspan + '"><div><i class="fa fa-comment-o right5"></i>'+ data['comments'] + '</div></td>')

		// add some classes and attributes
		$(row).addClass('response response-'+data['parent_docid']);
		$(row).attr('data-position',position);
		$(row).addClass('response-level-'+position.split('.').length)

		// add a reference to the parent doc
		$(row).attr('data-parent-docid',data['parent_docid']);

	}

	$(row).click(function(ev) {
		$('[data-position^="' + position + '."]').toggleClass('hidden');
		$('td:first div .fa',this).toggleClass('fa-caret-down');
		$('td:first div .fa',this).toggleClass('fa-caret-right');
	});
}
I also add a little CSS to create the indentation of the responses:
table.dataTable tr.response-level-2 td {padding-left:100px}
table.dataTable tr.response-level-3 td {padding-left:125px}
table.dataTable tr.response-level-4 td {padding-left:150px}
Now looking at the View, we are starting to see a result more like what we would expect. We can expand and collapse the responses by clicking the parent row and any response row that has responses, but we have a little bit more work to do. I need to add a visual indicator to those rows so the user can see they have responses.

To do that I’m going to add a drawCallback function. With that I want to accomplish the following:
- Add a visual indicator to any row that has response documents. Using FontAwesome, a twistie icon is added to the first column of any row with responses to simulate the classic Notes look. The great thing is this is completely customizable. I chose the first column for simplicity.
- Move the node of each response so they appear after the parent. This is not an issue when the View first loads, but is necessary when the View is sorted or filtered.
drawCallbackResponse : function() {

	// retrieve data from browser sessionStorage
	var responses = sessionStorage.getItem('responses') != '' ? JSON.parse(sessionStorage.getItem('responses')) : {};

	// loop through each item
	// responses are stored in an object with the parent docid as key
	for (var key in responses) {
		if (responses.hasOwnProperty(key)) {
			// prevent dupes
			$('[data-parent-docid="' + key + '"]').remove();
			var pos = '.'+key;
			// insert each response after
			for (var x=0;x<responses[key].length;x++) {
				pos = $(responses[key][x]).insertAfter(pos);
			}
		}
	}

	$('.response').each(function() {
		var post = $('.'+$(this).attr('data-parent-docid'));

		if ($('.'+$(this).attr('data-parent-docid') + ' td:first div .fa-caret-down').length==0 &&
			$('.'+$(this).attr('data-parent-docid') + ' td:first div .fa-caret-right').length==0
		) {
			$('.'+$(this).attr('data-parent-docid') + ' td:first div').prepend('<i class="fa fa-caret-down right5"></i>');
		}
		pos = $(this).insertAfter(pos);

		if ($('.fa').hasClass('fa-caret-right')) {
			$(this).addClass('hidden');
		}
	});
}
Now we have a fully functional View with response documents in a hierarchy. We can click the column headers to change the sort order of the View and the responses will still travel with their parent.

But we still have an issue .. filtering the View will make the responses disappear because the response rows don’t contain the same data as their parent.

Again, we have all of the tools we need to overcome this. Using the initComplete callback functionality of the control, we can store the html of all response rows in the sessionStorage of the browser when the View initialization is complete:

initCompleteResponse : function(_v,dataTableClass) {
	var responses = {};
	var oa = [];
	var o = {};

	$('.response').each(function() {
		//store the html of response rows
		if (typeof (responses[$(this).attr('data-parent-docid')]) == 'undefined') {

			responses[$(this).attr('data-parent-docid')] = [];
		}
		var html = $(this).clone().wrap('<p/>').parent().html();
		responses[$(this).attr('data-parent-docid')].push(html);
	});
	sessionStorage.setItem('responses',JSON.stringify(responses));
}
You may have noticed in the drawCallback function there was a reference to the sessionStorage:
// retrieve data from browser sessionStorage
var responses = sessionStorage.getItem('responses') != '' ? JSON.parse(sessionStorage.getItem('responses')) : {};
By doing this little bit of caching we can ensure that we can get the responses back into the table even if the DataTables filtering removes these records from the display.

Conclusion
The combination of the createdRow (or rowCallback), initComplete, and the drawCallback functions give us the power to rebuild the response hierarchy of a Notes View in the Flexible View Control for XPages.
Humbled to be an HCL Ambassador for 2021
Posted: December 15, 2020 Filed under: Domino, HCL | Tags: Domino, HCL, HCLAmbassador 1 CommentHCL has announced the HCL Ambassador Class of 2021 and I’m very honored to be on this list for the first time.
The HCL Ambassadors Program recognizes customers and partners who go above and beyond to promote HCL Software products, engage with the community, and help others.
Thank you to those who nominated me, and to HCL for selecting me based on the criteria above. We’ve all had enough of 2020 at this point, so here’s to 2021!
Flexible View Control for XPages – Mashing Up Total Columns and Category Renderers
Posted: December 14, 2020 Filed under: DataTables, Domino, JavaScript, jQuery, low-code, XPages | Tags: DataTables, Domino, JavaScript, jQuery, low-code, XPages 1 CommentIn a recent blog post we covered the concept of ‘Category Renderers’, which allows the user to easily alter the visual representation of category rows in a categorized View. Combining this functionality with totals columns, highlighted in the last blog post in this series, we can further enhance Views in XPages and make them more user-friendly than their Notes counterparts.
The Mission
Continuing with our dataset from previous posts of used cars available in Wilmington, DE I want to display the average PRICE of each MAKE of vehicle. In my View Definition I categorize the MAKE column:
Note: As you can see in the screenshot below, the View Definition has an option to display average values. This option currently doesn’t function properly and will be updated in the next release.

Then I add a Category Renderer to the MAKE column:

And I still have totals enabled for PRICE and MILEAGE:

The Category Renderer
The demoFn.category.convert_total_to_avg function is a function in a client-side js library. Remember, you do not provide any parameters to the function. This function is applied to every category row and the dom object for that category is automatically passed into the function as a parameter.
convert_total_to_avg : function(_this) {
	// _this is the category row dom element
	// take a total value for a category and instead display the avg value

	// get the total # of rows for this category
	var total_rows = $('.total_rows',$(_this)).html();

	// get the total PRICE for this category
	var total_value = $(_this).attr('total_price_values');

	// format the column that contains the total #
	$('.MILEAGE_total',$(_this)).html(total_rows+' (total)');

	// calculate and format the average price
	$('.PRICE_total',$(_this)).html('$'+$U.formatMoney((total_value/total_rows),0)+' (avg)');
}
Notice in the code above we are extracting the total_value from the attributes of the category tr. We are able to do so because when totals are enabled for a categorized column the Flexible View Control stores the accumulated data in the tr element for easy access:

The Result
Here is our result:

What About The Footer?
While we are achieving the desired outcome for each category, the footer still displays the total PRICE for all used cars in Wilmington, DE.

How do we get the average price for all used cars instead? In the next post we’ll show you how!
Flexible View Control for XPages – Adding Column Totals
Posted: December 7, 2020 Filed under: DataTables, Domino, low-code, XPages | Tags: DataTables, Domino, low-code, XPages 1 CommentWhen building Views in the Notes Client adding totals to one or more columns is a pretty common occurrence.

Does the Flexible View Control for XPages support column totals? Absolutely!
As usual, the power is in the View Definition
The Flexible View Control provides two options for displaying totals in View columns:

Total Rows
This option simply does what you would expect – totals the number of rows. This is equivalent to creating a column in a View, hard coding a ‘1’ for the value, and telling the column to total the values. Another advantage of the Flexible View Control … there is no need to create a special column to display the total rows and no need to worry about selecting the ‘hide detail rows’ option to hide all those 1s in your View. Instead, simply pick any column, turn on Total Rows, and the total will display at the bottom of that column.
Total Values
Again, this option does exactly what you would expect it to do and adds up the value contained in each row and displays the total in the footer at the bottom of the View.
Building A Demo
To get started with a demo for this post I created brand spanking new View Definition called wilmington-de-totals, pointed it to the same View in the Used Cars database I’ve used for most of the other demos, and selected all of the data columns. To show Total Rows, I select that checkbox for the MILEAGE column and to show Total Values, the PRICE column.

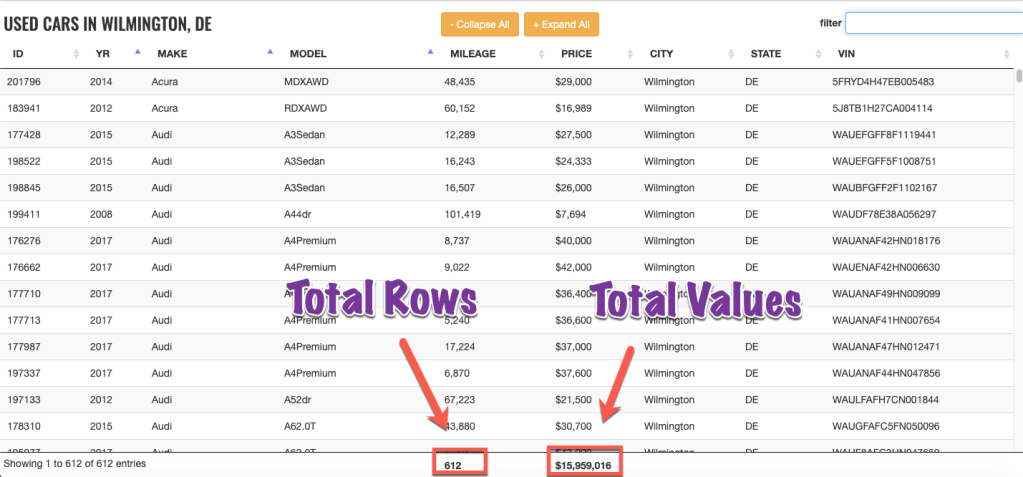
Did you notice … the total value displayed in the PRICE column is formatted as currency to match the data type of the values in the individual rows.
An argument could be made that the Total Rows option is not needed since we have the DataTables info box in the bottom left corner. However, the Flexible View Control has a custom property that controls whether the info section is displayed, or not. So some may opt to turn it off and display the total rows under a column.

Here’s what it looks like:

What About Filtering?
What happens if you enter a value in the search box and filter the view based on that value? The totals displayed reflect the filtered value. In the example below, I searched for all of the Land Rovers. The total PRICE contains values only for the Land Rovers, as does the Total Rows displayed under the MILEAGE column.

Category Totals
One of the great, unique features of Notes Views is the ability to have total columns in a categorized View and display totals for each category in addition to the full column total. With the Flexible View Control, when either of the totals options is enabled, categorized Views will also display the totals for each category by default:

Summary
Organizations that have been Notes/Domino shops and start to move their apps off of the Notes Client and into the browser still expect some of the standard functionality provided by Notes Views. The Flexible View Control for XPages strives to meet those expectations and also to exceed them by providing additional functionality that we, as developers, were not able to provide for our users within the Notes Client.
In the next blog post we will take the Totals functionality a step further and mash it up with the Category Renderer functionality from a previous post to show how to create richer Views for our users.
Flexible View Control for XPages – Category Renderers
Posted: December 2, 2020 Filed under: Bootstrap, DataTables, Domino, JavaScript, low-code, XPages | Tags: DataTables, Domino, JavaScript, low-code, XPages 1 CommentWhat is a Renderer?
In the DataTables world, “Renderers” play an important role in creating the visual representation of a table. In fact, behind the scenes the Flexible View Control uses Renderers to display all of the data in a View. In the future, I will be posting about creating custom renderers to further enhance the Flexible View Control, but this post focuses on “Category Renderers” in keeping with the category/subcategory theme of recent posts.
Technically speaking, Category Renderers are not the same as standard DataTable Renderers. But the concept is the same – taking a data input and altering the output that is presented to the user.
Building a Category Renderer Demo
Let’s pick up where we left off in the previous post with our subcategory demo. I made a copy of the View Definition used in this demo and called it ferraris-category-renderer. Take look at the MODEL column:

Underneath the category checkbox is another checkbox labeled “Renderer”. Clicking this reveals a pop-up window:

In this box I can enter a function string without parameters in the same way that callback functions are configured in the FVC custom properties. If a value exists in this box, then after the categories are drawn in the DataTable, the dom element for each MODEL category row is passed into the function defined in the category renderer box:
 // does this group need a renderer?
if (o.columnCategory[x].categoryRenderer != null && o.columnCategory[x].categoryRenderer != "" ) {

	$('.group-'+o.columnCategory[x].itemName).each(function() {

		var fnstring = o.columnCategory[x].categoryRenderer;
		if ((typeof fnstring) == "undefined" || fnstring == null) {
			return;
		}
		if (fnstring.indexOf('.') > -1) {
			var fn = window.getFunctionFromString(fnstring);
		} else {
			var fn = window[fnstring];
		}

		// is object a function?
		if (typeof fn === "function")  {
			fn(this);
		} else {
			console.log("renderer error")
			return;
		}
	});
}
In the screen below I’ve entered a function name into the category renderer box. This is just a client-side JavaScript function that lives in a demos script library.

Category Renderers are JavaScript functions
Starting simple, I’m just going to change the font for the MODEL category row. *Technically* this should be done with CSS instead of a renderer, but it’s fine for a simple example:
model_renderer : function(_this) {
	// _this is the row dom element
	console.log('category renderer')
	$(_this).css({
		'font-family':'Oswald',
		'font-size':'1.25em'
	})
}

A more practical use for the category renderer is to manipulate the dom node for the category. For this next example I’m going to wrap the category value in a Bootstrap label:
model_renderer : function(_this) {
	// _this is the row dom node

	$(_this).css({
		'font-family':'Oswald',
		'font-size':'1.25em'
	});


	// add a Bootstrap label
	var v = $('.group_value',$(_this)).text();
	$(_this).find('.group_value').addClass("label label-success")

}
Checkout the demo: http://demos.xpage.me/demos/datatables-xpages-bootstrap.nsf/viewCategories.xsp?viewdef=ferraris-category-renderer&key=make:ferrari

Summary
In summary, Category Renderers can be a valuable, low-code tool that adds functionality to Views created with the Flexible View Control for XPages and provide a more rich experience for your users.
